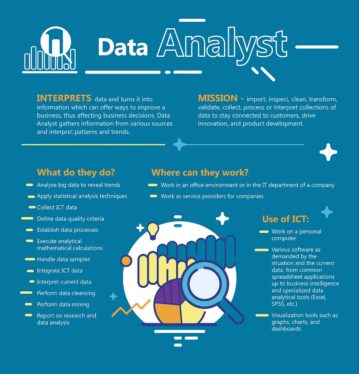
Data Analysts use raw-form data or information to devise a pattern or identify trends. They use this data to tell a story for business decision-makers to plan steps for future success. In simpler words, the primary goal of a data analyst is to work with large volumes of raw but complex data, producing conclusions to help their company solve problems.
A data analyst possesses analytical skills that pertain to various analytical tools, software and programming languages. Data experts will typically need to be familiar with SQL, Microsoft Excel, Python, R programming, critical thinking and presentable reporting. After identifying data-fed insights, these professionals provide perspective for business functions like marketing, sales, consumer relationship strategies and product strategy.
Data analysts have the exciting job of identifying meaningful insights by playing with numbers and charts — but they can’t do it alone. They need an accurate, efficient way to learn from the data they collect, typically by using a variety of data tools.
Here are a few of the fields that data analysts need experience in.
Data Visualization
A data analyst can source signals from data. But to make those conclusions readable for others, data analysts must illustrate the process and results. This process communicates the impact of their findings and identifies any suitable actions to be taken. An analyst’s job includes building visually striking charts, aligning data, reflecting them in charts and gather key numbers in a dashboard.
Statistics & Probabilities
An analyst has a strog reliance on mathematics and probability. Some of the statistical functions will be utilized on a very frequent basis. Others will only be used occasionally.
Microsoft Excel
Microsoft Excel doesn’t seem to have lost its charm, even though the last decade has produced so many advanced tools and programming languages. Much of the longevity of spreadsheets is rooted in the way data is presented. If you are an in-practice analyst, you’re probably already pretty adept with Excel basics. However, with the remarkable depth of this tool, there’s always a chance you don’t know a specific shortcut or a lengthy formula that could make your life even easier.
Google Analytics, Data Studio & Trends
Analysts often fall into the marketing department, helping other marketing professionals and sales personnel steer toward success. When that is the case, getting into a relationship with a Google tool is inevitable. With digitalization and shift of customers towards digital touchpoints, Google has played a massive role in understanding how consumers react to various marketing strategies and digital advertisement efforts. Thus, using Google’s highly sensitive marketing analytics tools is a must. Some of the strongest, most widely used tools include Google Analytics, Data Studio and Trends. You may use Trends to identify popular search topics, use Data Studio to build reports or study customers visiting your digital touchpoints through Analytics. Google provides a wealth of valuable information about how well your site is performing and how to attract more qualified customers.
Using Google tools on a regular basis can yield real value if you can automate your reports and dashboards. However, not everything can be automated. Some short-term projects are not worth the effort or time to automate reporting. Adopt automation on a case-by-case basis in tandem with Google resources.
SAS
The SAS programming language was developed for data management and analytics. It’s high on the list of languages you’ll need to know, especially if you want to advance into machine learning and data science. SAS is frequently used in business and academic settings to predict outcomes based on existing data patterns.
R
The R programming language was developed specifically for statistical calculations. It’s used to organize data and create graphs. Data analysts often use R to import and clean data, and sometimes favor it over other languages since it lends itself to a wide variety of statistical computations.
SQL
SQL one of the top-most coding languages in terms of preference by statisticians and analysts. Experts in SQL have been considered masters of their trait. The tool is perfect for aligning tables with large datasets, allowing multiple other users to work with the same data without worrying about overwriting each other’s work.
Python
Most data analysts are familiar with Python. From data analysts to data scientists, web developers to application developers, Python is a favorite to various tech-based roles who use it to their advantage. The language isn’t just numbers and data. In the world of programming, Python is considered to be one of the most versatile languages. Newly-educated programmers often find it easy to grasp the concepts of Python, given its structure and simple syntax. Python offers great versatility and a simple-to-read format.
There are seemingly endless applications that use Python, along with a wide variety of software tools. For data analysts and data scientists, Python is considered to be a must-have skill. The variety of options you can explore with Python is hardly possible with other languages.
Data Analytics Careers
Data is a critical asset in any industry that serves customers. Whether it is business to business, business to consumer or business to employee, a business cannot exist without customers. Data analysts gauge data from various sources, pertaining to a number of different scenarios. Each scenario will be analyzed to understand how better companies can serve customers.
Here are a few of the different types of data analysts that companies can hire:
- Data Analyst
- Business Analyst
- Financial Analyst
- Operations Analyst
- Risk Analyst
- Research Analyst
- Data Journalist
- Business Intelligence Analyst
- Financial Analyst
- Marketing Analyst
Whatever the title may be, the core task of data analyst is always converting data into actionable business insights.
If you’re considering a career in data analysis, we recommend you enroll in our Data Science and Analytics Bootcamp offering all the in-demand skills including Transact-SQL, Microsoft Excel, Power BI and Data Visualization. Our bootcamps also feature e-books, practice exams, certification training, live sessions with industry experts and a 12-month job assistance post-graduation support policy.
Talk to our experts and discuss your future goals to get proper guidance on how you can master the art of data analysis.
https://www.quickstart.com/data-analysis-and-visualization/what-is-a-data-analyst/


